Burn-Up Chart
A Burn-Up Chart is an Agile project management tool used to track progress toward completing a project or achieving a sprint goal. Unlike a Burn-Down Chart, which focuses on the remaining work, a Burn-Up Chart highlights the work completed over time. This dual perspective helps teams see how much progress they’ve made and how much work remains, making it easier to identify trends and potential obstacles.
Key Characteristics of a Burn-Up Chart: #
1. Work Completed: The primary focus is on the cumulative amount of work completed over time.
2. Total Scope: Shows the total amount of work to be done, providing context for the progress made.
3. Clarity: Helps teams understand their progress and any changes in scope over time.
Components of a Burn-Up Chart: #
1. X-Axis (Time): Represents time, typically in days, weeks, or sprints.
2. Y-Axis (Work): Represents the amount of work, often measured in story points, tasks, or hours.
3. Work Completed Line: A line that shows the cumulative amount of work completed over time.
4. Total Work Line: A line that represents the total amount of work to be done.
Example of a Burn-Up Chart #
Let’s use the same example of an e-commerce website project with a two-week sprint (10 working days). The team has committed to completing 100 story points during this sprint.
Initial Setup: #
– Sprint Duration: 10 days
– Total Story Points: 100 points
Example Burn-Up Chart: #
1. Day 1:
– Work completed: 10 points
– Total work: 100 points
2. Day 2:
– Work completed: 20 points
– Total work: 100 points
3. Day 3:
– Work completed: 30 points
– Total work: 100 points
4. Day 4:
– Work completed: 35 points
– Total work: 100 points
5. Day 5:
– Work completed: 45 points
– Total work: 100 points
6. Day 6:
– Work completed: 55 points
– Total work: 100 points
7. Day 7:
– Work completed: 65 points
– Total work: 100 points
8. Day 8:
– Work completed: 75 points
– Total work: 100 points
9. Day 9:
– Work completed: 85 points
– Total work: 100 points
10. Day 10:
– Work completed: 100 points
– Total work: 100 points
Sample Burn-Up Chart Visualization: #
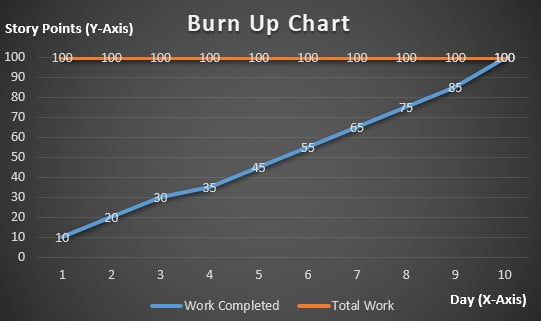
Interpretation of the Burn-Up Chart: #
– Work Completed Line: This line shows the cumulative amount of work completed over the sprint. It starts at zero and moves upward as work is completed.
– Total Work Line: This line remains constant if the scope of work doesn’t change. If additional work is added or removed, this line will move accordingly.
Benefits of Using a Burn-Up Chart: #
1. Progress Visibility: Provides a clear view of how much work has been completed and how much remains.
2. Scope Change Tracking: Easily tracks changes in the total scope of work, providing insight into scope creep or reduction.
3. Motivation: Visual representation of progress can motivate the team by showing their achievements.
4. Trend Analysis: Helps identify trends in work completion, allowing for better forecasting and planning.
Example with Scope Change: #
Imagine mid-sprint, additional 20 story points worth of work is added.
1. Day 6:
– Work completed: 55 points
– Total work: 120 points (100 original + 20 additional)
2. Day 7:
– Work completed: 65 points
– Total work: 120 points
3. Day 8:
– Work completed: 75 points
– Total work: 120 points
4. Day 9:
– Work completed: 85 points
– Total work: 120 points
5. Day 10:
– Work completed: 100 points
– Total work: 120 points
Sample Burn-Up Chart Visualization:

In this case, the Total Work Line would jump up on Day 6, indicating the increase in scope, while the Work Completed Line continues to show progress.
Conclusion #
A Burn-Up Chart is a powerful tool for Agile teams to visualize progress and manage scope. By tracking the cumulative work completed against the total scope, teams can maintain transparency, stay motivated, and adapt to changes more effectively. This dual perspective provides valuable insights for better planning and decision-making throughout the project.


